Flower дашборд для мониторинга celery
Дашборд для мониторинга задач [celery]. Ссылка на документацию
Real-time monitoring using Celery Events
- Task progress and history
- Ability to show task details (arguments, start time, runtime, and more)
- Graphs and statistics
Remote Control
- View worker status and statistics
- Shutdown and restart worker instances
- Control worker pool size and autoscale settings
- View and modify the queues a worker instance consumes from
- View currently running tasks
- View scheduled tasks (ETA/countdown)
- View reserved and revoked tasks
- Apply time and rate limits
- Configuration viewer
- Revoke or terminate tasks
Broker monitoring
- View statistics for all Celery queues
- Queue length graphs
HTTP API
Basic Auth, GitHub OAuth2 and Google OpenID authentication
Prometheus integration
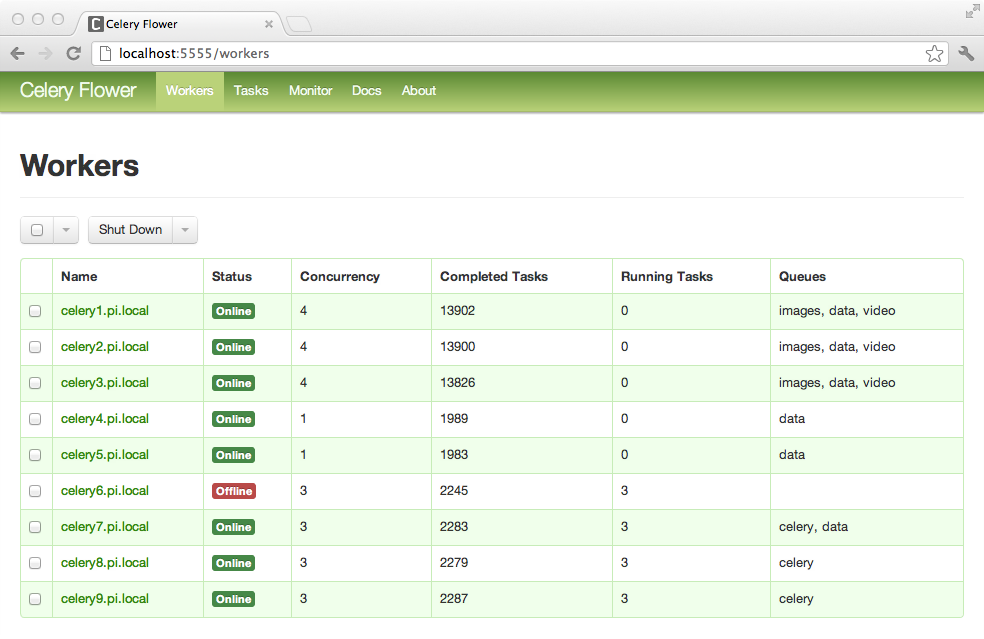
screenshots
workers dashboard
instalation
pip install flower
configuration
Variants of setting confs
From the command line:
celery flower --auto_refresh=False
Using flowerconfig.py configuration file:
# RabbitMQ management api
broker_api = 'http://guest:guest@localhost:15672/api/'

# Enable debug logging
logging = 'DEBUG'
Or, using the environment variables. All flower options should be prefixed with FLOWER_:
export FLOWER_BASIC_AUTH=foo:bar
Options passed through the command line have precedence over the options defined in the configuration file. The configuration file name and path can be changed with conf option.
celery flower --conf=celeryconfig.py
В основной доке смотри API, интеграцию с [prometeus], работу с реверс-прокси и прочее.
Вот решение проблемы в [fastapi]: [fastapi-template-flowers-problem]
Смотри еще: